
By Rex Hammock
Founder and CEO
I used to hear adults complain about the way teenagers’ symbol-laden language was taking over communication. I don’t hear that complaint anymore. Those adults now text me complaints. ?
I am fascinated with the evolution of the symbolic text we are using @ ? & @ ?. Of course, emojis are the most pervasive examples of symbols replacing letters, words, and phrases. But I’m more interested in the evolution of what I describe as business and professional “font icons.”
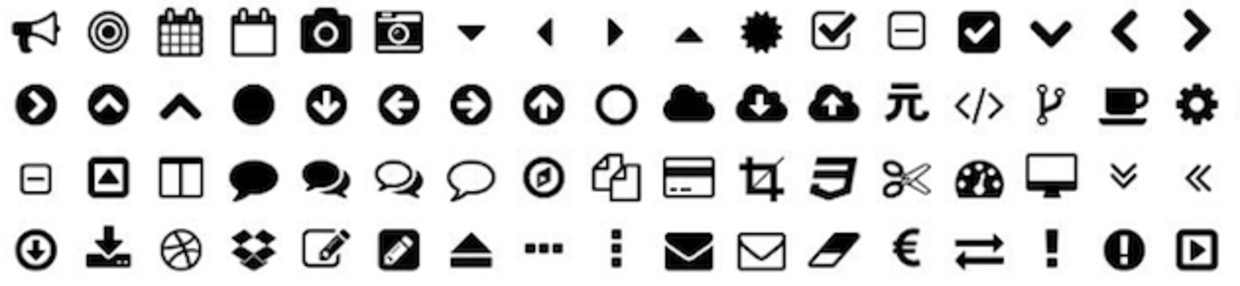
You’ve probably never thought of professional-level emojis, but you see them all the time. Look at your screen or monitor and you’ll see the symbols I’m talking about. Need help? Look for symbols like little arrows or battery-charging icons. You’ve seen them on hundreds of mobile apps for years. Thanks to the 2011 release of some font icons that were part of the free “front-end framework” called Bootstrap, one set of font icons, or glyphicons, have become especially ubiquitous. Here are just a few of the free glyphicons that were part of the original Bootstrap release.
A few years ago, I began to wonder if such glyphicons could be used in short statistical-oriented articles written for the web (in addition to their original intent as symbols for mobile app development). As a media marketer, my primary interest was trying to simplify the display of data without creating an infographic file. I wanted the articles to have machine-readable text that would be seen by Google. But I also wanted to give human users (our favorite kind) a standard approach to understanding this type of data article.
We experimented using Hammock’s web property, SmallBusiness.com. It is a great place for this type of experiment as every day we receive press releases filled with mind-numbing and impossible-to-follow numerical data. What’s worse, press release writers interchangeably use numbers like “75 percent” in endless ways—from 75% to three-quarters to three out of four in the same paragraph. In other words, they have no standard way of organizing or visualizing data.
For example, notice the multiple ways data is formatted in a typical press release:
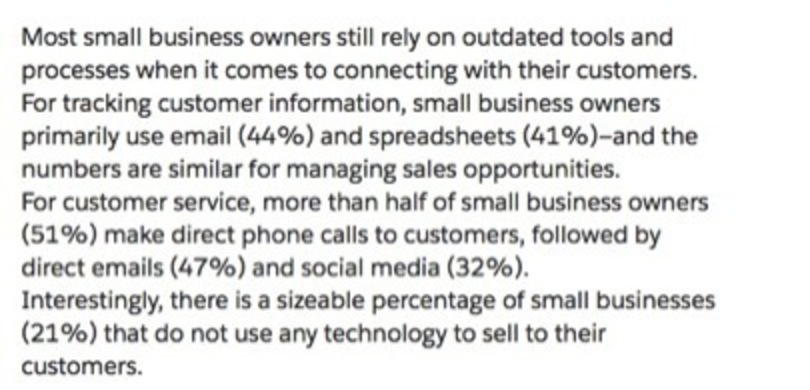
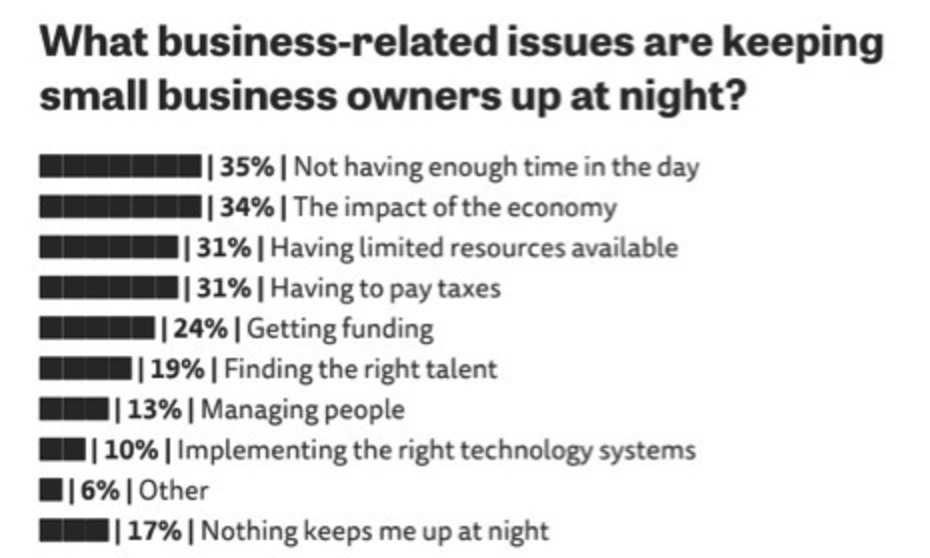
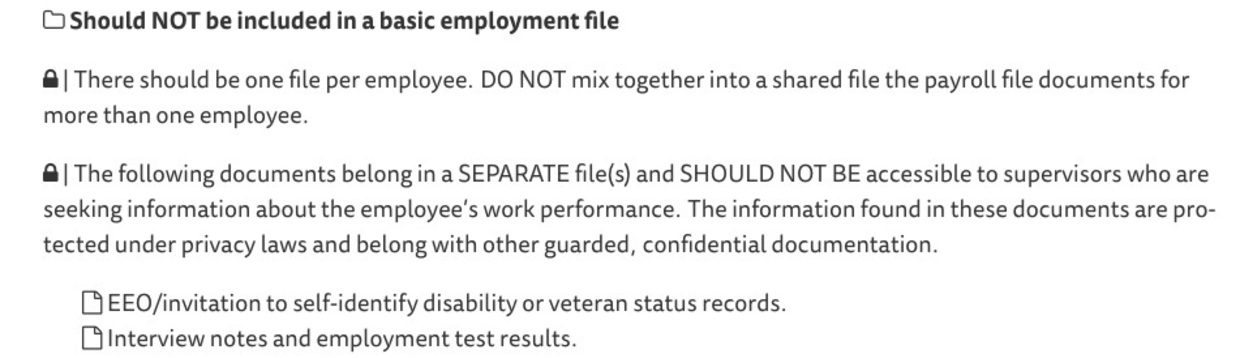
To make the data more comprehensible to our users, we converted the numbers into standardized formats using font icons (e.g., in Example 1, a font icon for small black boxes was used to create a bar chart). Every time we now use any numbers, we format them in the same way. Here are two examples. (Note: On the pages where these examples originally appear, you can see how the text surrounding glyphicons can be highlighted, cut and pasted like any text. In this email, we’ve used images for the examples below.)
Example 1: In-text use of Bootstrap font icons to create a bar graph
See original here.
Example 2: In-text use of Bootstrap font icons to create a bullet point list
See original here.
Bottom line for marketers: Over time, we predict you’ll see the integration of font graphics, or glyphicons, into the body text of articles appearing on the web. Rather than confuse the audience, these icons will be helpful in organizing information. Get ready for grown-up emojis.
Image: iStock and SmallBusiness.com
About Hammock Idea Email | This post is part of Hammock’s award-winning Idea Email series. Idea Emails are sent every other week and share one insightful marketing idea. Idea Email comes in two flavors: Original and Healthcare. To subscribe to the original Idea Email (general marketing ideas), click here . To subscribe to the Healthcare Idea Email (healthcare marketing ideas), click here.